HyperDiagrams and VR Topology
Attending re:Invent 2018 (my first) admittedly left me with a case of bedazzled fanboyism, and some notes on what the future may hold in store for AWS as it continues to create managed, automated infrastructure and enable the pure act of building.
Read Part I, Embracing the Automation of Everything: NoCode/LowCode Speculation.
HyperDiagrams: Contextual Charting & Visual Debugging
I have to commend AWS on their debug-forward thinking as they roll out new components. Lambda debugging, CodeDeploy debugging (now in VS Code), and Central Logging are all great ways to gain insight into applications behavior.
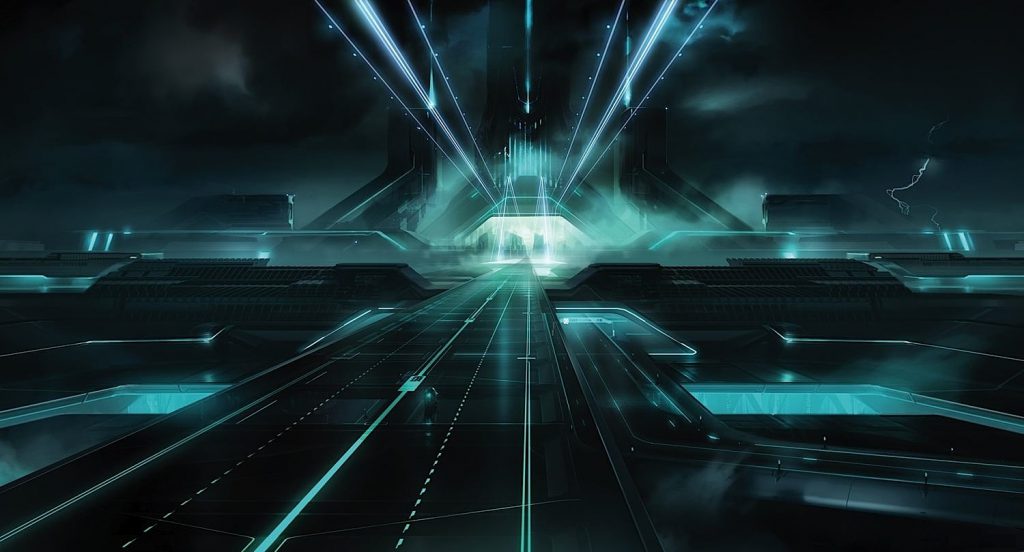
Proper tagging and segmentation, along with some of the basic visualizations AWS provides can help you grasp what’s happening under the hood. But what I want is more than assistance. When I visualize code behavior it’s more metaphorical. Alright, it’s basically Tron. I want Tron.

That’s right, I want to see the code literally moving through the system, with separate threads/processes as motorcycles, and race conditions literally represented by a bike race, and…<gasp! breathe!>
You get the idea.
But I’m willing to start with something more basic – let’s say a dynamic improvement on existing charting. An example with great potential is Lucidchart, which brilliantly lets you import AWS data and autogenerates a network diagram based on your existing configuration.
If ever a company were primed for acquisition by AWS it would be Lucidchart – from it’s AWS inspired color theme to articles on Amazon’s own site extolling its virtue. It also appears in the AWS marketplace, but I’m not clear on why one would go that route, as Lucidchart seems to be a standalone SaaS.
So let’s bring it all together – take powerful logging and debugging and combine it with a robust diagramming solution, and now we can create HyperDiagrams – diagrams which form, not by static configuration, but by the dynamic passage of actual data through a network.

Imagine: as a tagged unit of data makes its way through various systems, it appears within a real-time diagram (motorcycle icon optional), along with the ability to see transformations of the data, triggered subsystems, etc. Not only would this allow developers to visually debug code, but it could allow features, triggered by feature tests, to self diagram . The ramifications are huge – from rapid bug repair, to decreased developer onboard time, to massively improved, autogenerated multimedia project documentation. The data is there, and I hope/predict AWS will take this next step in an effort to simplify interaction with the complex architectures builders can achieve.
VR Network Topology
I’m not an avid gamer, besides a few obsessive bursts with Monument Valley, but I am excited about VR/AR, especially AR’s potential to enhance our visual field with relevant information. So I regularly try to envision how products like the new Hololens 2, which will initially be targeted towards professionals, might be used to improve developer/architect efficiency.
Visualization of network topology seems like a clear use case within the IT space. As networks become increasingly complex, the ability to visually navigate through thousands of containers across hundreds of segregated networks is enticing.
I’m far from being the first person to consider such a thing; companies like Cisco and have already made moves in this space, and others, like Hyperglance, are clearly contemplating it. With AWS’ 2017 announcement of Sumerian, it’s clear they’re bullish on VR, and well poised to offer such a tool to their customer base. Couple this with HyperDiagram style dynamic information, and debugging code moves from 2-D tracking on a map to a 3-D adventure. Change the perspective to first person, and developers can literally become the data as it moves through the network.
Consider, finally, with a well abstracted markup (e.g. Network Description Language) we can decouple the visual representation from the underlying data. In other words, the complex networks we create can be visualized as regular computers, or as the metaphor of our choice – even human actors inside a vast, blue-lit world…a grid, a digital frontier.
